How token credits work in AI plans
A token-credit AI plan counts usage in the plan's own credits, not dollars. What a credit buys, how multipliers work, and why the value can be a range.
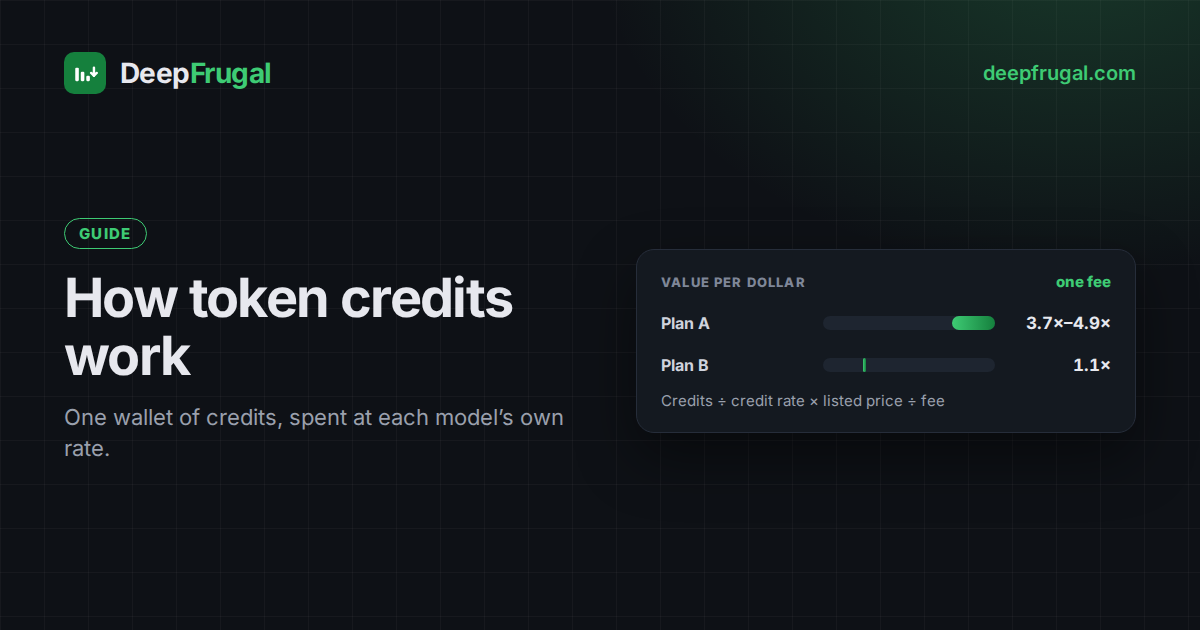
A token-credit plan does not count its monthly wallet in dollars. It counts it in the plan's own credits, and each model spends a different number per token. This guide explains how those plans work — the wallet, the multipliers, and how far a small fee really goes.
One of three kinds of AI credits
- Dollar credit — the wallet is a budget of dollars, spent at the models' listed rates. How AI credits work covers that case.
- Token credit — the wallet is the plan's own credits, and each model spends a different number per token. This is the case below.
- Usage limited — messages, tasks or a shared pool, with no token or credit amount published at all.
Everything below applies to token-credit plans.
What a token credit is
A plan grants one wallet of credits for the month. Each model has a multiplier: the credits one million of its tokens costs. The wallet divided by the multiplier gives tokens; the model's listed price turns those tokens into dollars. A high multiplier gives few tokens, a low one gives many.
How the multiplier works
The multiplier is not one number. It is set per token type — input, cached and output — so the same wallet buys a different amount of each. A higher multiplier spends more credits for the same tokens, so it draws the wallet down faster.
Do the model quotas add up?
No. The plan grants one wallet, not one per model. Each model's token quota is the same wallet restated at that model's multiplier, so adding the quotas together counts the plan several times. What matters is how much of the one wallet your mix spends.
How much can the plan really give you?
The most a plan can cover is its biggest single-model quota — the listed usage you get if you spend the whole wallet on one model. Split the wallet across models with smaller quotas and you cover less, even when the wallet is fully used. The mix decides.
When a plan's multipliers are not proportional to its listed prices, the same fee buys a different amount of listed usage per token type, so value per dollar is a range, not a point. When the multipliers do track the prices, the value is close to a single number.
How the wallet is spent
The plan spends the one wallet on the models in the order listed. Each model takes its share, and never more than what is left, so the running total stops at the full wallet. The first example fits inside it; the second runs past it, and the extra usage is paid outside the plan at the listed rate.
Why the cost per token falls, then rises
Read the curve by its average, not by the next token. Inside the wallet the fixed fee spreads over more and more tokens, so the average falls. It reaches its lowest point at the limit of the wallet. Above the limit the extra tokens are paid outside the plan at the listed rate, so the average climbs back towards it. On a token-credit plan the limit is the tokens the wallet buys at the model's multiplier.
Token credits vs pay-as-you-go
Compare the curve with a flat pay-as-you-go rate — the price you pay when you buy tokens one by one. It crosses twice. The first crossing is where the subscription starts to beat the cheapest pay-as-you-go route. The second is where it loses again, because the extra usage above the wallet costs more than paying per token. In between is the sweet spot: the plan covers everything and the average is still falling. That is where the fee gives the most value.
Peak and off-peak multipliers
Some plans charge fewer credits at quiet hours. A window like that does not change the listed price; it changes how fast the wallet is spent, so the same fee stretches over more usage. It matters most for usage that comes in short, heavy bursts.
See it on a real plan
The figures above use sample numbers. Here is the same rule on a live plan. The table below lists each model's multiplier — the credits one million tokens costs, per token type — and the wallet the plan grants. The rates table then shows what those credits buy at the listed prices.
Browse every AI subscription plan in the live table, or learn how to find the best plan for your usage.
Run your numbers
Put your own mix against a plan. Pick a plan, add models and set the monthly usage. The calculator spends the one wallet in the order shown, marks the break-evens and states the cheaper side.
Not sure how to read it? How the break-even calculator works.
Plans, promos and prices change over time. Check the live table for current values.
Compare live AI subscription prices
Every widget links back to the live comparison table, where you can filter by plan, price and privacy, and sort the results. Four tools cover the decision from different angles:
- Break-even calculator — work out the usage where a monthly plan becomes cheaper than paying per token. Step-by-step tutorial.
- Plan comparison — put the same monthly usage into two plans and see which costs less. Step-by-step tutorial.
- Plan finder — rank every plan and pay-as-you-go gateway on your own usage. Step-by-step tutorial.
- Plan head-to-head — compare two plans model by model on value per dollar. Step-by-step tutorial.
Related reading: how AI credits work covers the concept and the dollar case, and subscription vs pay-as-you-go walks through the calculator.
Summary
A token-credit plan is one wallet of credits, spent at each model's multiplier. Its best case is the biggest single-model quota; a mixed workload usually covers less. When the multipliers do not track the listed prices, value per dollar is a range, not a guarantee. Estimate your monthly tokens, then check the live table or run the break-even calculator.
Frequently asked questions
What is a token-credit AI plan?
A subscription whose monthly wallet is counted in the plan's own credits instead of dollars. You pay one fee and spend the credits during the month.
What is a token credit?
The plan's own unit of account. The plan grants one wallet of credits, and each model spends a number of credits per million tokens at its own rate.
Is a credit the same as a token?
No. A credit is the plan's accounting unit; a token is text the model reads or writes. The multiplier is the bridge: it says how many credits one million of a model's tokens costs.
What is a multiplier?
The plan's rate for a model: credits per million tokens, set per token type (input, cached and output). A higher multiplier spends the wallet faster.
How many tokens does a credit buy?
It depends on the model and the token type. Divide the wallet by the model's multiplier to get tokens; the listed price turns those tokens into dollars.
Do the per-model quotas add up?
No. The plan grants one wallet, not one per model. Each model's token quota is that same wallet restated at the model's multiplier, so adding them counts the plan several times.
Why can the value per dollar be a range?
When a plan's multipliers do not track its listed prices, the same fee buys a different amount of listed usage per token type, so value per dollar is a range. When the multipliers do track the prices, the value is close to a single number.
How is the wallet spent?
On the models in the order listed, each taking its share, and never more than what is left. Usage above the wallet is paid outside the plan at the listed rate.
Why does the cost per token fall, then rise?
The fee is fixed and spreads over more tokens as you use more, so the average falls to its lowest point at the limit of the wallet. Above it extra tokens are paid outside the plan, so the average climbs again.
When does a token-credit plan beat paying per token?
In the middle of the curve. Use too little and the fee is not recovered; use too much and the extra usage costs more than buying tokens directly. The sweet spot is between those two points and the wallet limit.
Do off-peak hours change the price?
No. A quiet-hours window charges fewer credits, so the wallet stretches over more usage. It changes how fast the wallet is spent, not the listed price.
How do I check a real plan?
Estimate your monthly tokens, then open the break-even calculator and read where you land against the break-evens. It values a plan against the cheapest pay-as-you-go route. The step-by-step tutorial shows how to read it.