New: the plan break-even calculator with the full cost curve
DeepFrugal's plan break-even calculator draws the whole cost curve: the quota limit, the cheapest pay-as-you-go route and the three overflow bases.
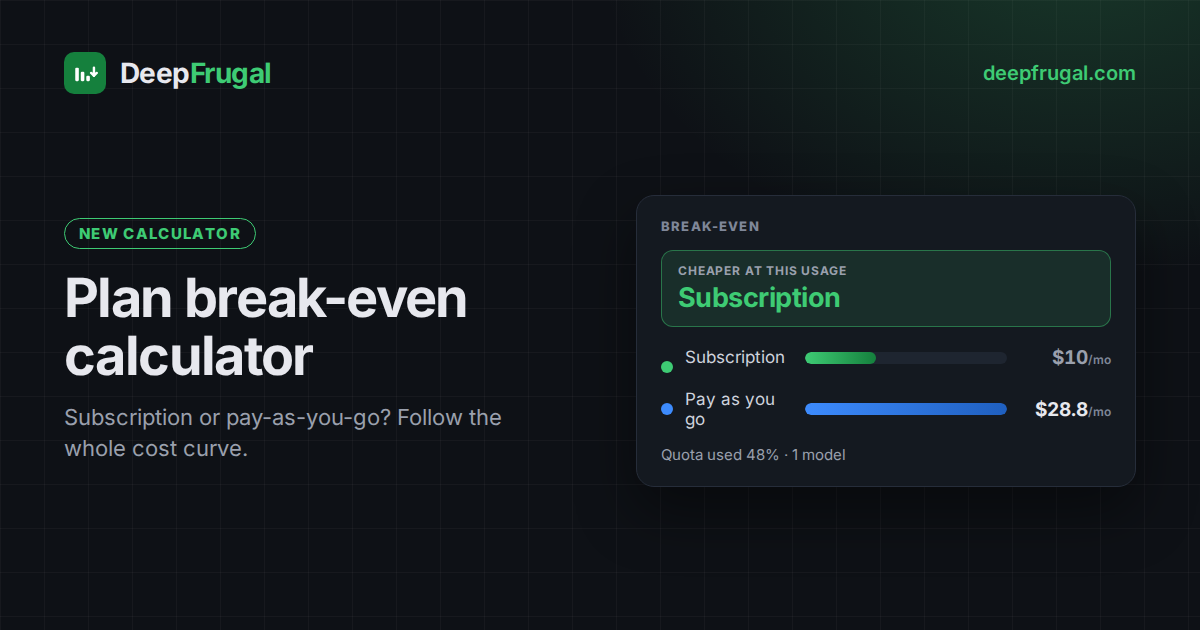
DeepFrugal has a new page: a standalone plan break-even calculator. It answers one question — is a monthly subscription plan cheaper than paying per token for your usage? — and now draws the whole cost curve, not just a single verdict.
What the calculator does
The calculator values your monthly usage at the listed rates and compares it with a plan's flat subscription. It reads four token types:
- Input — fresh prompt tokens.
- Cached read — prompt tokens served from cache, usually cheaper.
- Cached write — tokens written into the cache, when the provider charges.
- Output — generated tokens.
The result is a verdict line, two cost cards and a chart. The chart plots the average cost per 1M tokens as your usage grows: it falls inside the quota, reaches the plan's effective rate at the quota limit, then follows the overflow base. (A subscription quota is one budget spent at the listed rates — see how subscription credits work.) It marks the quota usage break-even, the plan break-even and the point where the subscription loses to the cheapest alternative.
Start from a preset, or build your own
Load a preset — Light, Medium or Heavy · agentic — or build the mix under Model mix. Each model carries its own usage. The plan grants one monthly budget for the whole mix; the calculator allocates it in the listed order and marks any usage it cannot cover as pay-as-you-go. Reorder the mix to approximate your own pattern.
Three overflow bases
Open Options to set what the plan bills above its quota:
- Listed price — the model's own listed rate (the default).
- Cheapest pay-as-you-go — the cheapest real route found for each model, so the plan is compared against the best metered alternative.
- The cheaper of the two.
The base changes the curve's climb above the quota limit and can move the point where the subscription stops winning. Promo prices in the same panel toggles the figures between the current promo and the pre-promo list rates.
Read the panels
Three collapsed panels explain the result. How the graph is calculated spells out the curve. How the plan quota is consumed lists each model's share of the budget and its pay-as-you-go excess. Effective rates (listed vs effective) shows the listed and effective price per token type.
From one plan to every plan
The result links to the plan finder, which ranks every subscription plan and pay-as-you-go gateway against the same mix. Its top row is the cheapest pay-as-you-go route: each model billed at the cheapest real rate found across every gateway, so a subscription has to beat the best possible no-plan option. To compare two subscriptions on one workload instead, open the plan comparison tool.
Every calculation is shareable
The page writes its state to the URL. Change the plan, the models, the usage or the options, and the address bar follows. Copy the link from the Share button to keep a calculation or send it to someone else.
Articles can link to a preconfigured calculation the same way. A link such as
/tools/plan-break-even/?plan=<plan>&mix=<models>&overflow=metered opens the page
with the plan, the mix and the overflow base already set.
The calculator is experimental
The calculator is marked Experimental. Confirm every figure against the provider's own pricing before you rely on it. Plans, promos and quotas change over time; the calculator recomputes on every page load from the same data as the main table. Every price tooltip cites the method.
Next step
Open the standalone calculator to run your own numbers, then rank the field in the plan finder. To filter plans by provider, context, latency and privacy, use the live table.
Frequently asked questions
What is the new page?
A standalone plan break-even calculator that compares any subscription plan with pay-as-you-go billing and draws the cost curve across your usage.
How is it different from the widget inside articles?
It is the same calculator on its own page, with a plan picker, preset workloads, the chart, the quota breakdown and a shareable URL.
What is the overflow base?
What the plan bills for usage above its quota. You choose the model's listed rate (the default), the cheapest pay-as-you-go rate found for it, or the cheaper of the two.
Does it remember my inputs?
Yes. The plan, the model mix and the options live in the URL, so you can bookmark or share a calculation.