LLM cost per token: listed vs effective
The listed price is not the real cost per token. How subscriptions, reseller fees, cached tokens and peak hours change the cost per million tokens.
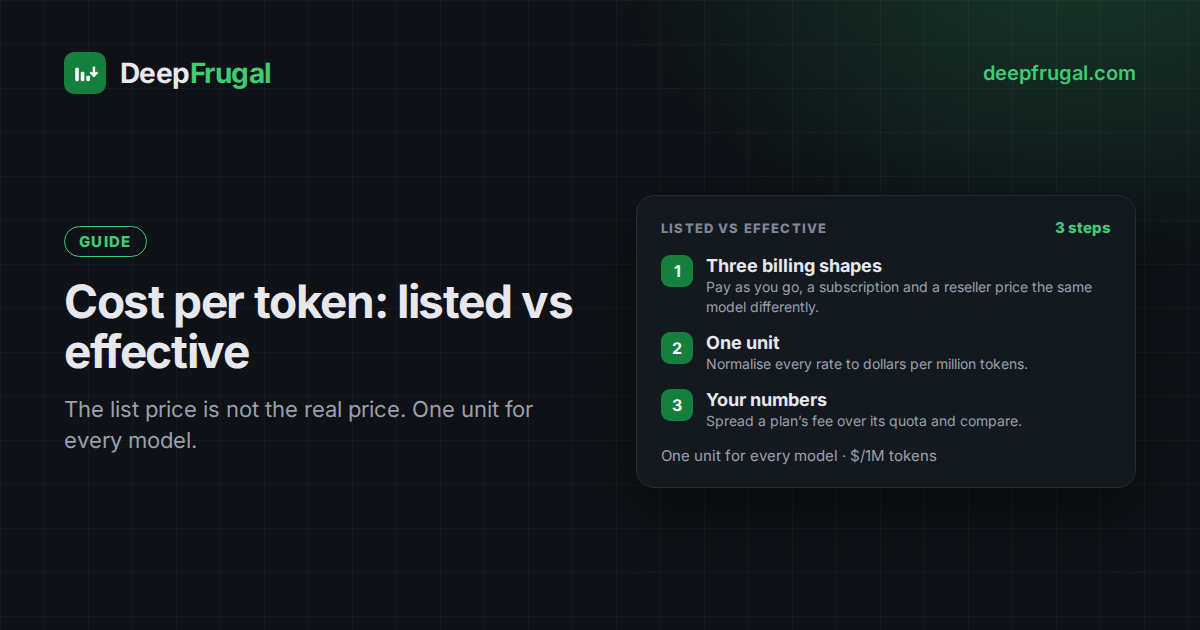
A price per token looks simple: a number of dollars for a million tokens. That number is a list price. What you pay depends on how you buy — a subscription spreads a flat fee over a quota, a reseller adds a service fee, and caching and peak hours change the rate again. This guide explains the difference between the listed price and the effective price per token, and how to put every model and plan on the same unit.
Why the list price is not the real price
Gateways publish prices in three shapes. To compare them, DeepFrugal normalises all three to $ per 1M tokens.
| Billing | Real price |
|---|---|
| Pay as you go | The listed price. |
| Subscription | Listed × (subscription ÷ quota). |
| Reseller | Listed × (1 + service fee). Sales tax is not included. |
A subscription does not charge by the token. It charges a flat fee for a quota of included usage. Spread that fee over the tokens the quota buys and you get a lower rate per token — the effective rate. The more of the quota you use, the closer the effective rate falls to its floor.
The effective rate is a best case: it assumes you use the whole quota. Use less and the fee is spread over fewer tokens, so the real rate is higher.
The effective cost formula
The listed rate is the anchor. Each billing shape scales it:
- Pay as you go —
effective = listed. - Subscription —
effective = listed × (subscription ÷ quota). - Reseller —
effective = listed × (1 + service fee).
The subscription term is the one that moves. A quota is a budget of dollars, and each model spends it at its own listed rates, so the same fee buys a different number of tokens per model. A cheap model stretches the quota further; an expensive one drains it faster. For the full picture, see how AI subscription credits work.
Here is one model's listed and effective rates in a real plan:
Turn on the effective column to see the rate with the plan applied. The toggle in the live table does the same for every model.
Reseller fee and tax
Some gateways resell another provider's models and add a service fee on top. The
fee is a percentage of the listed price, so the effective rate is
listed × (1 + fee). A fee is not tax: sales tax is separate and is never
included in a DeepFrugal price. Confirm the tax treatment with the provider.
Add the fee before you compare. A reseller that looks a few percent dearer on the listed rate can widen once the fee is in.
Cached tokens
Most providers bill cached input at a lower rate than fresh input, and some charge a separate cache write fee. Four token types therefore drive the real cost:
- Input — fresh prompt tokens.
- Cached read — prompt tokens served from cache.
- Cached write — tokens written into the cache, when the provider charges.
- Output — generated tokens.
A cached read pulls the average down; a cache write pushes it up. The rates table above lists the types this plan publishes, and the live table carries the same columns for every model.
Peak, off-peak and tiers
Some providers charge less at quiet hours and more at peak hours, and some price long-context or priority requests as a separate tier. These are not a discount on the listed price; they are separate rows, each with its own listed rate and its own effective rate. Compare them as different models.
How to compare models and plans
Put every candidate on the same unit — dollars per million tokens, effective — and the comparison becomes arithmetic:
- How AI credits work explains what a plan's quota covers, and why the per-model quotas do not add up.
- How token credits work in AI plans covers plans whose quota is counted in the plan's own credits.
- Subscription vs pay-as-you-go turns the effective rate into a decision: when a subscription wins.
Run your numbers
Estimate your monthly input, cached read, cached write and output tokens, then put them against a plan. The calculator values your usage at the listed rates, spreads the plan's fee over its quota, and shows where the subscription starts to win.
Not sure how to read it? How the break-even calculator works.
Summary
The listed price is the price per token on pay as you go. A subscription and a reseller change it, and cached tokens and peak hours change it again. Normalise every model to the same unit — dollars per million tokens, effective — and you can compare them. Check the live comparison table for current values, or run the break-even calculator on your own usage.
Frequently asked questions
What is an effective price per token?
The listed rate scaled by how you buy it: a subscription spreads its fee over the plan's quota, and a reseller adds a service fee. It assumes the whole quota is used, so it is a best case.
Why is the listed price not the real price?
Because most plans do not charge by the token. A flat fee, a reseller fee, cached rates and peak hours all change what a million tokens costs.
How does a subscription change the cost per token?
It scales the listed rate by the subscription divided by the quota. The more of the quota you use, the lower the average rate falls.
What is a reseller service fee?
A percentage a gateway adds on top of another provider's listed price. It is not sales tax, which is never included in a DeepFrugal price.
Do cached tokens change the cost per token?
Yes. Cached reads are usually cheaper than fresh input, and a cache write may cost extra. The average depends on your mix of input, cached read, cached write and output.
Do peak and off-peak hours change the price?
They are separate rates, not a discount. A quiet-hours window has its own listed and effective rate, so compare it as a different row.
How do I compare two models on cost per token?
Put both on the same unit — dollars per million tokens, effective — and compare like for like. The live table does it for every model and provider.
How do I find my own effective rate?
Estimate your monthly tokens, then use the break-even calculator, which spreads a plan's fee over its quota.