Command Code Flash Fast vs Flash: the cache trap
Command Code gives both tiers the same quota, but Flash Fast bills cached reads at more than 5× the rate. A cache-heavy month runs out far sooner.
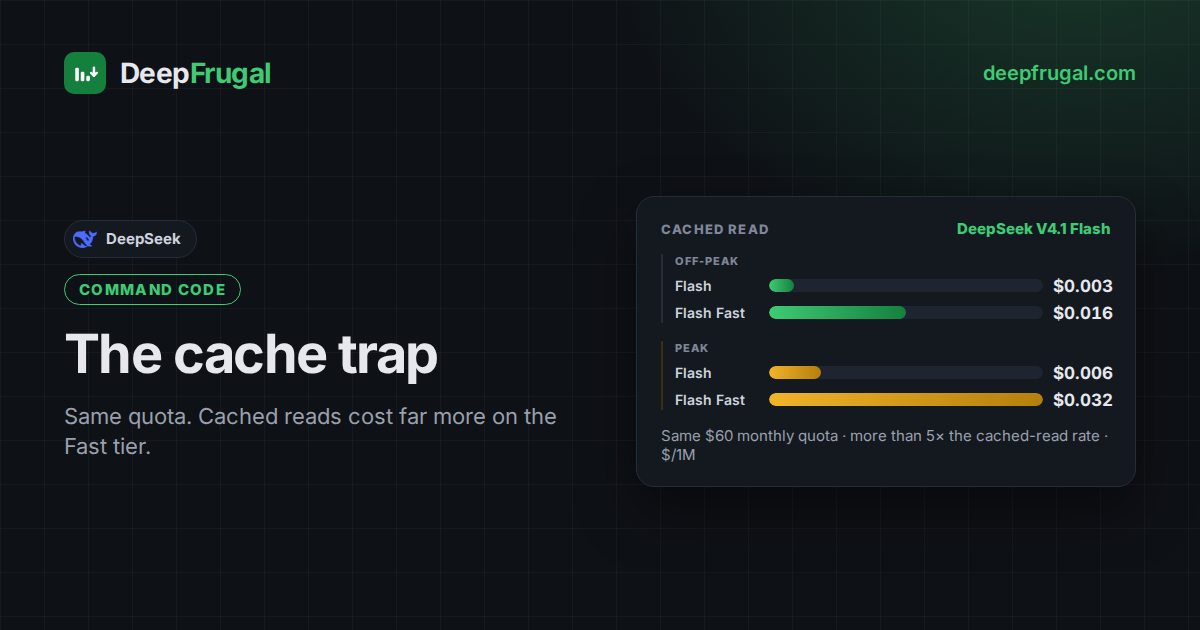
Command Code lists DeepSeek V4.1 Flash Fast next to the standard tier of the same model, and gives both the same monthly quota. Fresh input costs about the same on either tier. Cached reads cost more than 5× as much on Fast, and for a coding agent that is most of the bill.
The short version
- Small month, the tier does not matter. Below Fast's quota limit you pay the same monthly fee either way, so the Fast rate buys nothing on the bill.
- Big cache-heavy month, the standard tier wins. The gap grows with volume: the overflow is billed at listed rates, and the listed cached-read rate is where the tiers diverge.
- Fast is not a trap, just a different product. Its rates are not outrageous next to pay-as-you-go; they are expensive next to the same tokens on the standard tier. Buy it where throughput is what you are paying for, and leave it out of a batch job that rereads a large context.
The four Command Code rows
The model publishes four rows in the plan catalog: one per tier, one per time window. Read the cached-read column next to the input column. That is the whole story. The table opens on listed rates; switch to effective rates to see what a monthly fee spread over its quota really costs.
Command Code publishes the same window hours for both tiers, so the peak rows
carry the same shape as the off-peak ones. It publishes no throughput for any of
them: the column reads — because a rate nobody published is unmeasured, not
because it is slow. Benchmark the two tiers yourself if speed decides. The full
plan is in the live table.
Everything above is written against the catalog as it stood when the article was published. Rates, quotas and what each provider publishes change, so re-check the table before you decide.
Where the two tiers diverge
Input moves by a few percent between the tiers, and output moves the other way by about as much. Those differences wash out over a month. The cached-read rate does not: it is several times higher on Fast, and it applies to the largest slice of a cache-heavy agent's traffic.
A quota is spent at listed rates, so a higher cached-read rate is spent faster. That is the trap: the tier with the faster responses empties the same budget in fewer tokens.
A typical month against both tiers
The calculator below runs the same workload against the plan once per tier, at identical volumes.
The volumes are a typical month on DeepSeek V4.1 Flash driven by a coding agent: tens of millions of fresh input tokens against billions of cached reads, with output a fraction of the input. The observed ratio is what matters: reused context outweighs fresh input by an order of magnitude, and that is where a cache-heavy month actually spends.
The horizontal axis is total tokens per month on a log scale. The vertical axis is the average cost per million tokens. Each tier keeps its own quota-limit line, and the verdict names the cheaper side at the volumes you enter. Start from those volumes and overwrite them to match your own usage, including how much of the month lands in the peak window.
Conclusions
For a cache-heavy workload the standard tier is the cheaper one, and the reason is not the input rate. Both tiers spend from the same monthly budget; the standard tier simply gets more tokens out of it, because reused context is where the budget actually goes. The chart shows the mechanism: the Fast quota-limit line sits to the left of the standard one, so it runs out at a lower monthly volume, and everything after that point is billed outside the plan.
The check to run before choosing: how much of your traffic is a cache hit. On a cache-heavy agent that one number decides the bill. A month that barely touches the cache barely feels the rate difference, and one that rereads context all day feels all of it.
Next steps
- Rank every gateway for this model in the cheapest-endpoint guide.
- Value two subscriptions on your own mix in the plan comparison calculator.
- Check a plan against pay-as-you-go in the break-even calculator.
Frequently asked questions
What is the cache trap?
Both tiers carry the same monthly quota, so the fee is identical. But the Fast tier lists a much higher rate for cached reads, so a cache-heavy month spends that quota on far fewer tokens.
Is this only about Command Code?
Today, yes: Command Code is the only provider announcing the Fast tier, so this page values both tiers inside the same Command Code plan. The comparison itself is not Command Code specific: any provider that splits a model into a cached-read-cheap tier and a cached-read-dear one needs the same arithmetic.
Do peak hours matter here?
Yes. Each tier lists a peak and an off-peak rate, and the calculator splits your month across the two windows.
When is the Fast tier worth it?
When throughput is the thing you are paying for: a latency-sensitive workflow, an interactive loop, or a month so small the quota never runs out. Its rate is not outrageous on its own; it is just expensive relative to the same tokens on the standard tier, so it has to be used where the speed is worth paying for.
Does Command Code publish throughput for these tiers?
Not at the time of writing. The table keeps a throughput column and shows a dash for all four rows, because a provider that publishes no rate has not been measured, not because it is slow. Treat the speed claim as unverified and benchmark it yourself.
How do I test my own workload?
Edit the volumes and the peak share in the burn-rate widget, or sweep the usage scale, then confirm the live rates in the table. Always compare the two tiers on your own mix rather than on the listed rate alone.
How current is this?
Written against the catalog as it stood when the article was published. Rates, quotas and what each provider publishes change, so re-check the live table before deciding.